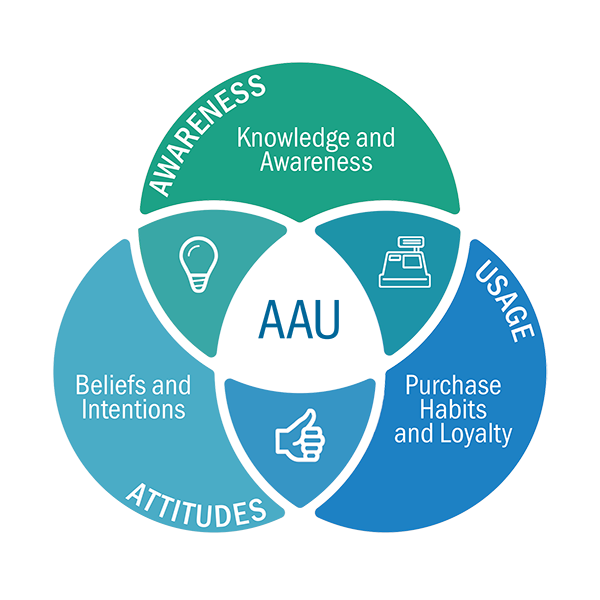
Definition
Awareness, Attitudes and Usage, or AAU is a tool focused on brand driver components. Studies of AAU enable marketers to quantify levels and trends in consumer knowledge, perceptions, beliefs, intentions, and behaviors. AAU studies are most useful when their results are set against a clear comparator. This benchmark may comprise the data from prior periods, different markets, or competitors.
Purpose
AAU metrics are used to determine trends in customer attitudes and behaviors. These metrics relate closely to an assumption that customers progress through sequential stages from lack of awareness, to awareness, to development of attitudes and beliefs about the product, through initial purchase, to brand loyalty. Information about attitudes and beliefs offer insight into the question of why specific users do, or do not, favor certain brands. Actionable Research generally conducts surveys of large samples of households or business customers to gather these data.
Construction
AAU studies feature a range of questions that aim to shed light on customers’ relationships with a product or brand, determining the acceptors and rejecters of the product, how customers respond to advertising content, etc.
Actionable Research ensures our stakeholders are engaged in meaningful dialog concerning brand research requirements, increasing confidence and allowing for better information transfer.
A concept test is a presentation of an idea, new technology, approach, or product, in varying states of completeness, that is designed to receive a response from a specific audience to determine its fitness for a market and its purpose, relative to its cost.
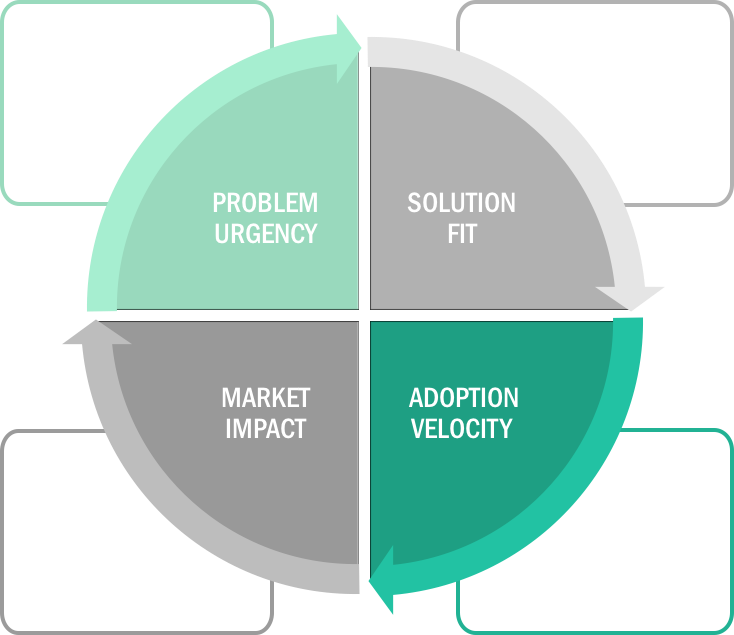
Actionable Research approaches the concept test through the lens of 4 dimensions: Urgency, Solution Fit, Adoption Velocity, and Market Impact.
In considering the idea of urgency within the scope of concept testing, we attempt to answer the foundational questions: 1. ‘Is the problem experienced a perceived issue which requires a solution?’ and 2. ‘How urgently is the solution required?’
Solution fit examines how well a concept solves the problem it is intended to solve: Does your concept present a solution in its entirety? Or is it supplemental? Do the costs weigh against the benefits? Does your concept require extra steps, a time commitment, additional products?
Adoption Velocity measures both perceived value and purchase intent. Measuring the strength of the value proposition relative to price enables a determination of price elasticity, an indicator of which price best matches the perceived value of the product – scientific price modeling is, in our opinion, imperative to ascertain prior to the launch of any new product. Purchase intent is a measurement not of need or desire for a product or service, but the actual intention to purchase. A failure to examine this component can lead to an inflated sales expectation.
The dimension of market impact examines how current purchasing behavior, relative to other “competitive” products, will be affected through the introduction of this new product. Understanding how your concept will affect competitive products (and sometimes your own product lines) is the final piece of this critical validation puzzle.

At times, there are research projects that are best described only as being exploratory. Yet, the term has rich meaning from a marketing research perspective.
Exploratory projects are one step beyond a qualitative research effort; that is; they are seeking to validate knowledge regarding a market, audience, product, or service, that roundly describes what is most important about it from a marketing perspective.
This means you can expect to see a number of different question types in an exploratory project, such as the following:
While Insight Streamer is designed for surveys with more compact questionnaires, the exploratory approach is the way to go when you are seeking to increase intimacy with a market or audience.
In order to best understand the perceived differences in importance between both available benefits as well as the perceived impact of trends and market conditions on their customers, Actionable Research recommends the implementation of a Maximum Difference Scaling (MaxDiff) exercise within the survey.
What is MaxDiff?
MaxDiff is an approach for obtaining preference/importance scores for multiple items (brand preferences, brand images, product features, advertising claims, etc.) using marketing or social survey research. Although MaxDiff shares much in common with conjoint analysis, it is easier to use (for the researcher, respondent, and end client) and applicable to a wider variety of research situations.
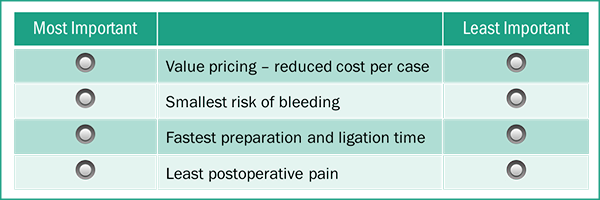
With MaxDiff, respondents are shown a set (subset) of the possible items in the exercise, and are asked to indicate (among this subset) the best and worst items (or most and least important, etc.), as seen right.
Respondents typically complete a dozen or more such sets where each set contains a different subset of items. The combinations of items are designed very carefully with the goal that each item is shown an equal number of times and pairs of items are shown an equal number of times. Each respondent typically sees each item two or more times across the MaxDiff sets.
Why use MaxDiff instead of standard rating scales?
Research has shown that MaxDiff scores demonstrate greater discrimination among items and between respondents on the items. The MaxDiff question is simple to understand, so respondents from children to adults with a variety of educational and cultural backgrounds can provide reliable data. Since respondents make choices rather than expressing strength of preference using some numeric scale, there is no opportunity for scale use bias. This is an extremely valuable method for cross-cultural research studies.
The Gabor-Granger method is a method to determine the price for a new product or service. It was developed in the 1960s by Clive Granger and André Gabor.
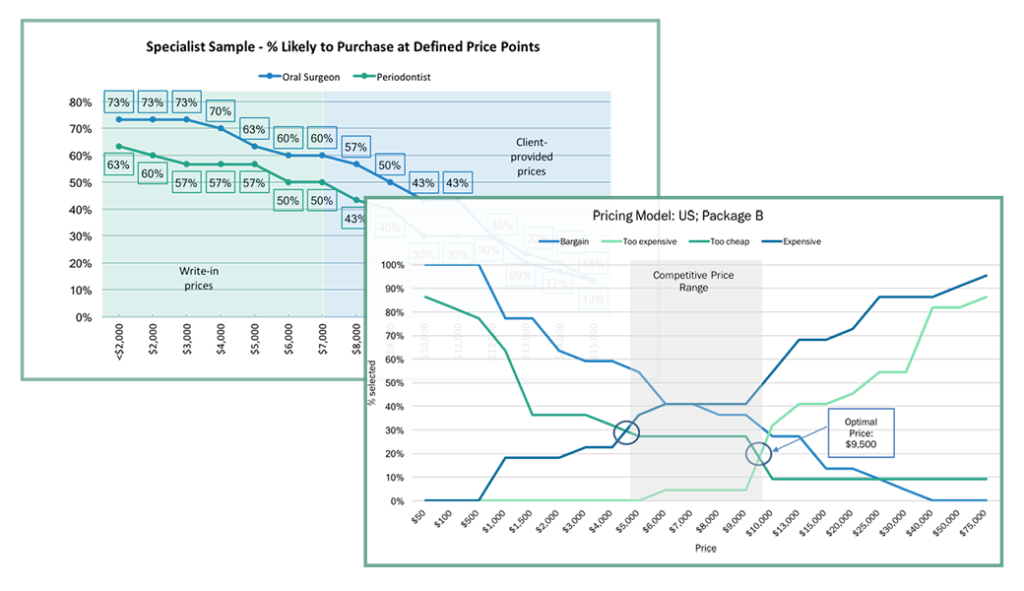
The Gabor-Granger method is used to find the highest price that respondents are willing to pay. This is most commonly done by choosing 5 price points that represent a proposed range of prices and subsequently asking respondents a 5-point purchase intent question for a random price chosen from those 5 established price points.
For example, say the 5 prices chosen are $1, $2, $3, $4 and $5. A first random chosen price might be $4. If the respondent chooses one of the top 2 responses (top 2 box score) for purchase intent, then there is only $5 left higher, so the respondent is asked the purchase intent question at that price. If they are top 2 box on $5 then the respondent is coded $5 as this is the highest price they are top 2 box willing to pay.
If they do not choose a top 2 box on $5 then the highest price the respondent is willing to pay is coded as $4. If the respondent is not top 2 box on $4, then they are asked a random lower price. This process continues until the highest price for each respondent is found based on the top 2 box purchase intent. This becomes the Gabor-Granger variable. If they are not top 2 for the lowest of the 5 prices, the respondent is usually coded either as missing and deleted from the analysis, or is asked to provide the highest price at which they are willing to purchase.
Once you have this Gabor-Granger variable, the results are used to produce a demand chart (where x-axis represents price and the y-axis the percentage of people willing to pay that price). In addition, a revenue curve (where y-axis is the percentage of optimal revenue and x-axis is still price) can also be developed, based on the total market opportunity and the percent of the population indicating they are likely to purchase at each price point.
The Price Sensitivity Meter (PSM), or also simply called Van Westendorp, is a market technique for determining consumer price preferences. The assumption underlying Van Westendorp is that respondents are capable of envisioning a pricing landscape and that price is an intrinsic measure of value or utility. Participants in a Van Westendorp exercise are asked to identify price points at which they can infer a particular value to the product or service under study.
In this model, price sensitivity does not equal absolute price, but the perceived “value” of the product or service. Price expectations and ranges are measured by asking a set of price perception questions, which are the key to the model, at which the product (is):
In addition to these “required” points of interest, purchase intent and perception of value questions are also included. The optimal price (i.e., the price at which market share and revenue are optimized) can then be computed, and the answers to the above four questions can be graphed.
The point at which the Inexpensive and Expensive responses intersect is considered the Indifference Price Point (IDP); the point at which the Too Inexpensive and Too Expensive responses intersect is considered the Optimal Price Point (OPP).
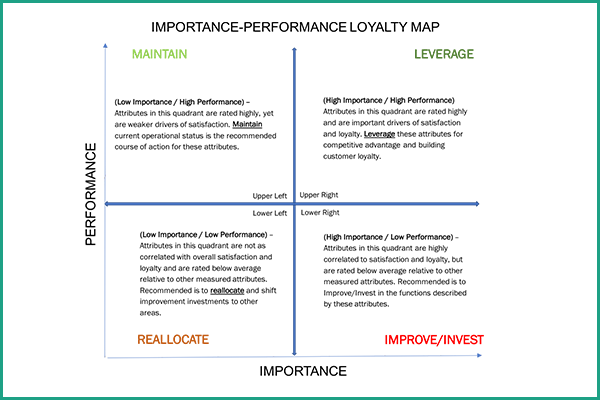
Customer satisfaction and loyalty studies yield a Performance-Importance ‘Priority Map,” which indicates the importance of each attribute measured on its correlation with overall satisfaction. This creates a hierarchy of attributes that are most likely to improve overall satisfaction by increasing performance.
Performance is the percent of top box scores (highly satisfied) given by the respondent (stated performance). The X and Y points that define the quadrants are the means of each measure (importance and performance).
The quadrants are defined as:

Markets consist of buyers, and buyers differ in one or more ways. Through market research, companies can divide large, heterogeneous markets into smaller segments.
Segmentation is concerned with identifying different groups of purchasers in a market in order to target specific products and services for each group or segment. By tailoring the product or service to different groups you are able to more precisely meet the needs of more customers and consequently to gain a higher overall level of share or profit from a market.
The process of segmentation starts with research and market analysis to identify key segments. To determine what customers think or believe about the category, questions employing banks of agree-disagree scales or ratings out of 5, 7 or 10 are utilized. The aim of these studies is not just to understand commonalities in opinion, but also what makes one group of users different from another.
To understand how attitudes affect purchase, statistical techniques such as “cluster analysis” are used where people with similar attitudes are combined. For instance, grouping those for whom the environment is important separately from those who think price is more important.
This information can then be used to target groups by what they think and how they feel, rather than just who they are. This is particularly valuable in determining branding strategies and keeping a brand in tune with consumers.